The Attention & Attraction Economy — cross-verified data index, all sources, all buckets.
SaadMay 2026~ 10 min scan16 sections · 6 charts
Methodology note
Every statistic in this appendix has been cross-validated against at least two independent primary sources. Where a figure was found to be viral but unverified (e.g., the “1 in 7 women on OnlyFans” claim), it is flagged with its verified replacement. Sources are inline-cited throughout.
Section 0
The Master Headline Stats
The six numbers that frame the entire argument.
Stat
Value
Source
Men are what % of the population
49%
Census
Men fund what % of the attention economy
~90%
Aggregate (see § 16)
Total annual men → women money flow (visible)
~$120B+ / year
Aggregate
Women initiate divorce
69–70% overall · 90% college-educated
ASA / Stanford
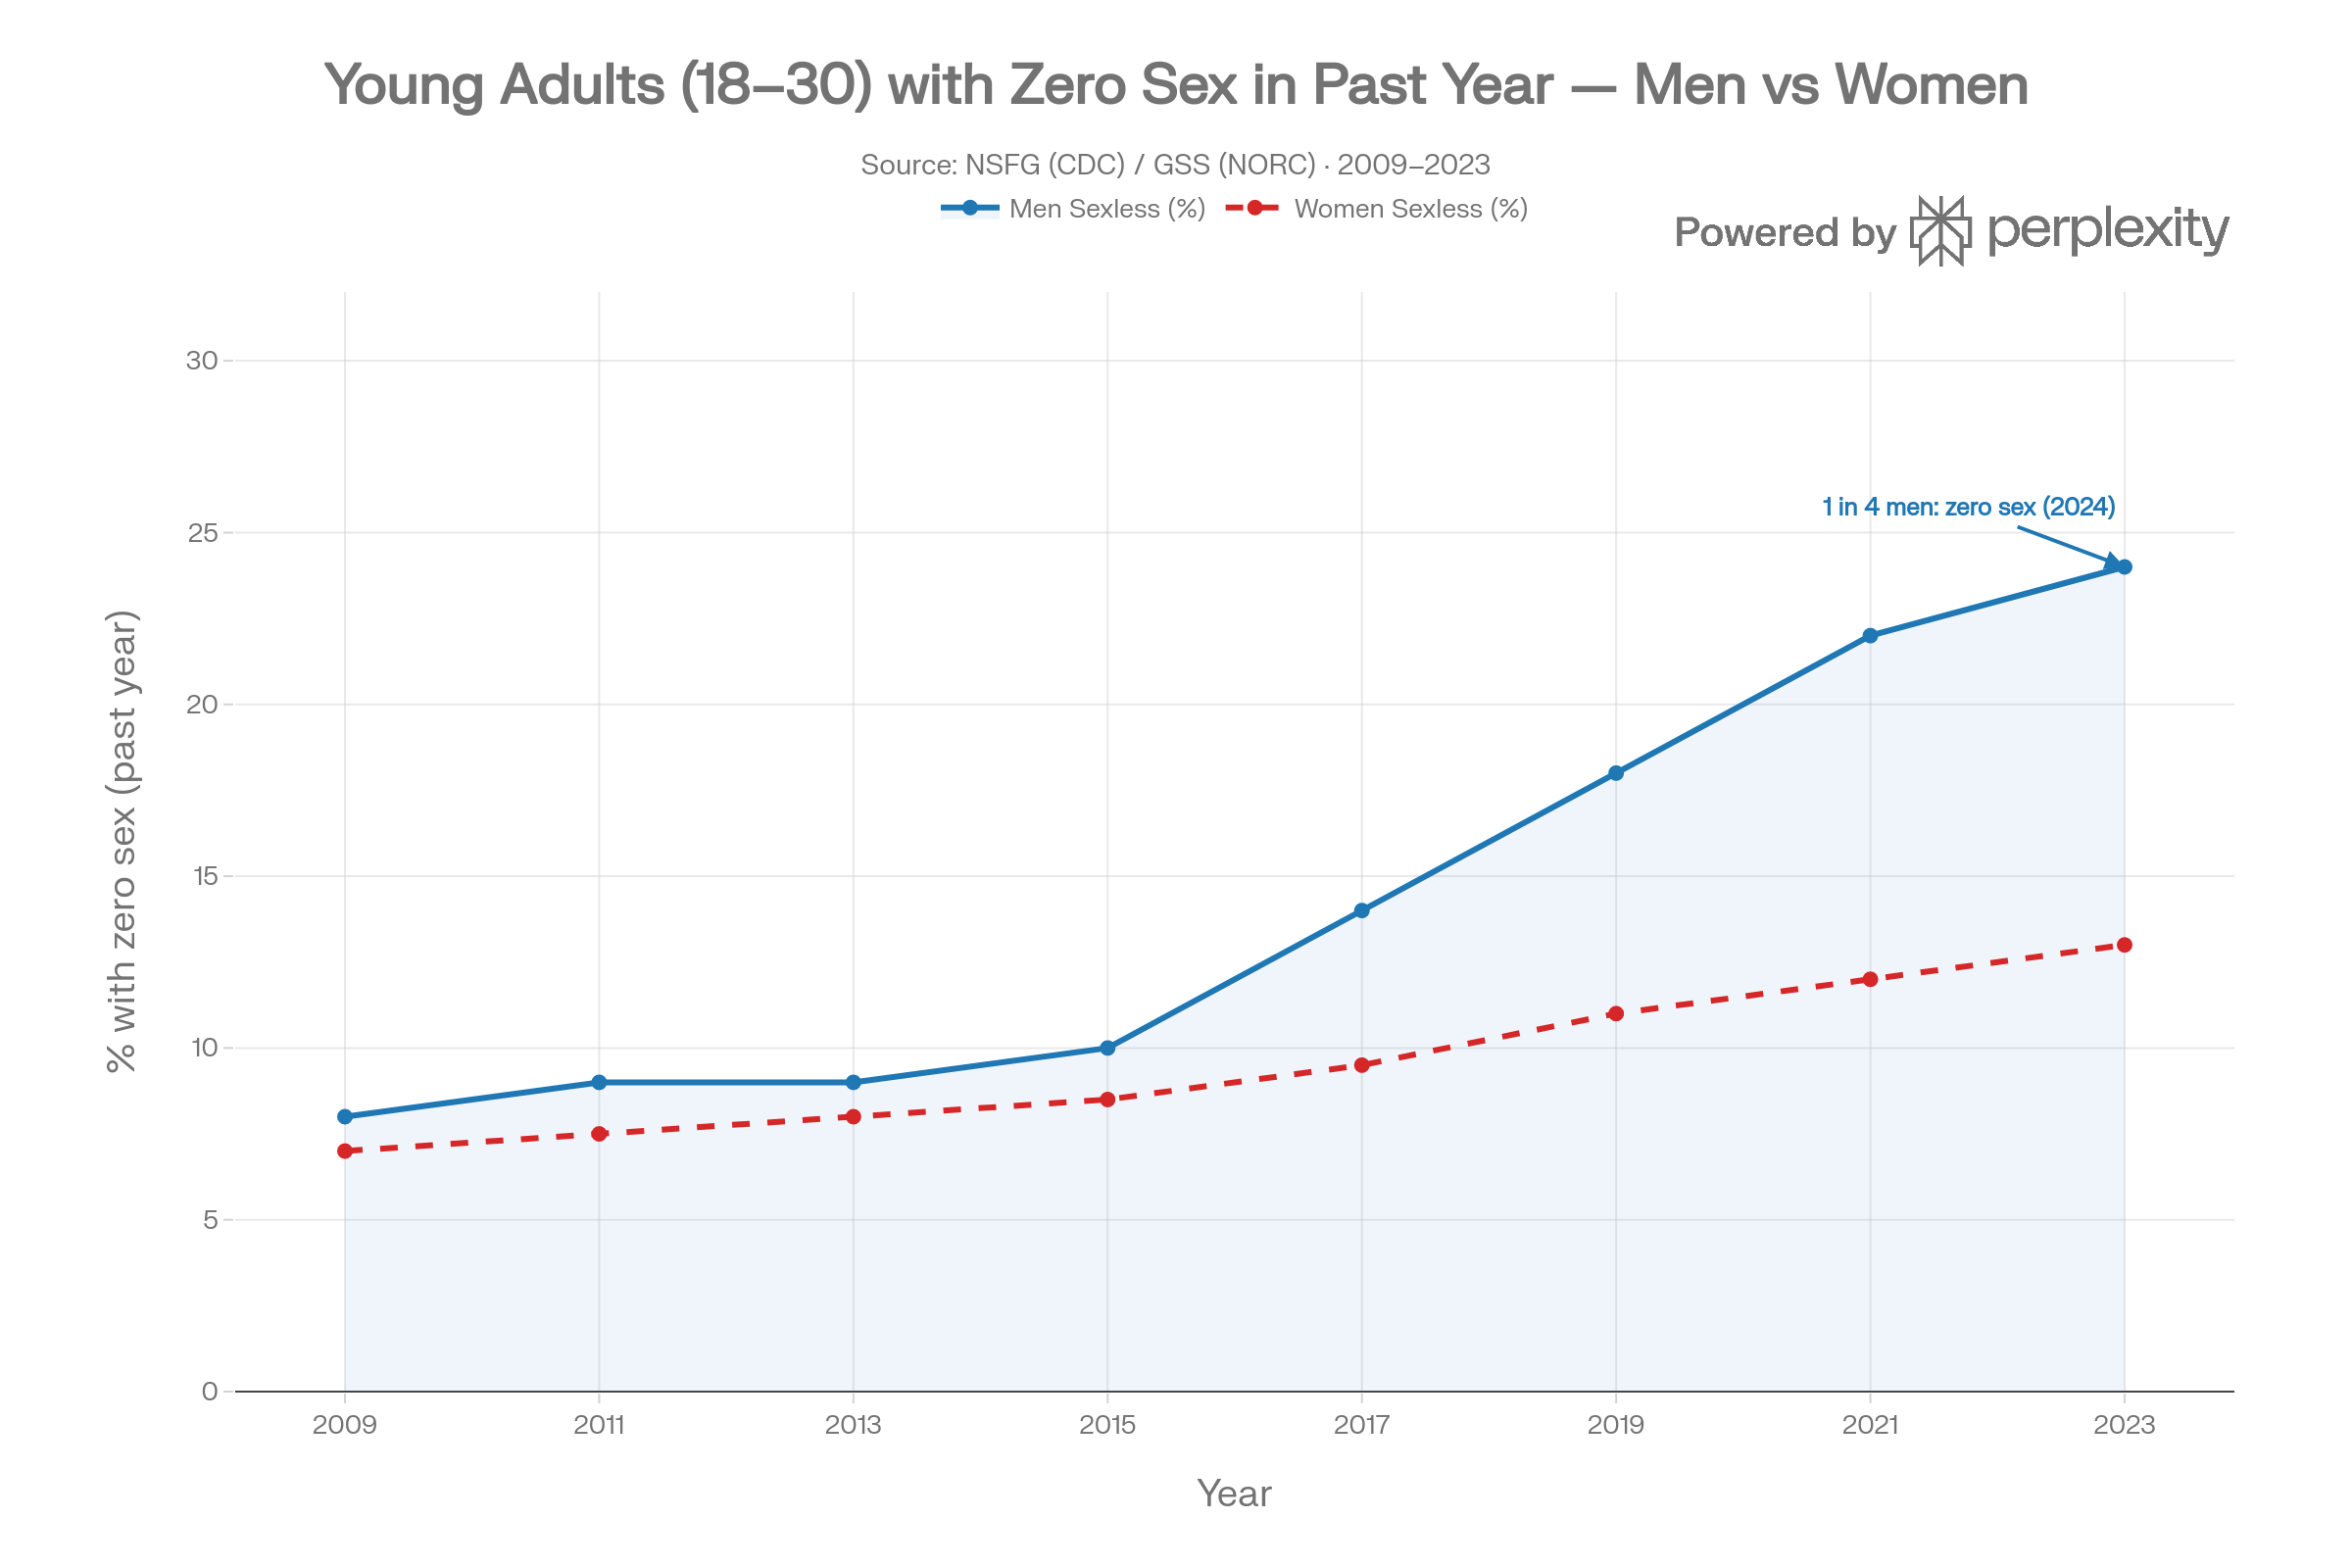
Men who are sexless under 30 (2024)
~25% — 1 in 4
GSS / CDC
Men under 30 who are single
63% — historic record
Pew 2024
Section 1
Evolutionary Baseline
The 300,000-year firmware.
Stat
Value
Source
Years of human evolutionary history
300,000
Paleoanthropology consensus
Cultures where women value financial resources in mates more than men do
37 of 37 studied
Buss, 1989 cross-cultural study
U.S. adults who say it’s very important for a man to support a family
71%
Pew Research
Same expectation for women
32%
Pew Research
Couples where the man earns more
69% of U.S. married/cohabiting couples
Pew Research
Women controlling U.S. investable assets by 2030
$34 trillion (38% of total)
McKinsey
Section 2
The Pyramid — Historical & Genetic
The asymmetry the modern internet did not invent — only revealed.
2.1 The Neolithic Y-Chromosome Collapse
Stat
Value
Source
Timeframe of collapse
~7,000 years ago
Karmin et al., 2015
Ratio of reproducing men to women during collapse
1 man per 17 women
Nature Genetics
Duration of bottleneck
~2,000-year window
Karmin et al.
Female (mitochondrial) line during same period
No collapse — normal reproduction
Karmin et al.
2.2 Historical Harems
Civilization
Elite Male
Women Controlled
Inca Empire
Emperor Atahualpa
1,500 concubines per provincial household
Inca nobility
Senior lords
700+ women each
Inca commoners
Average man
0 — death penalty for unsanctioned access
Ottoman Empire
Sultan
1,000+ women in imperial harem at peak
Qing Dynasty
Emperor
3,000+ concubines documented
Section 3
The Attention Sweet Spot
Verified age-desirability data.
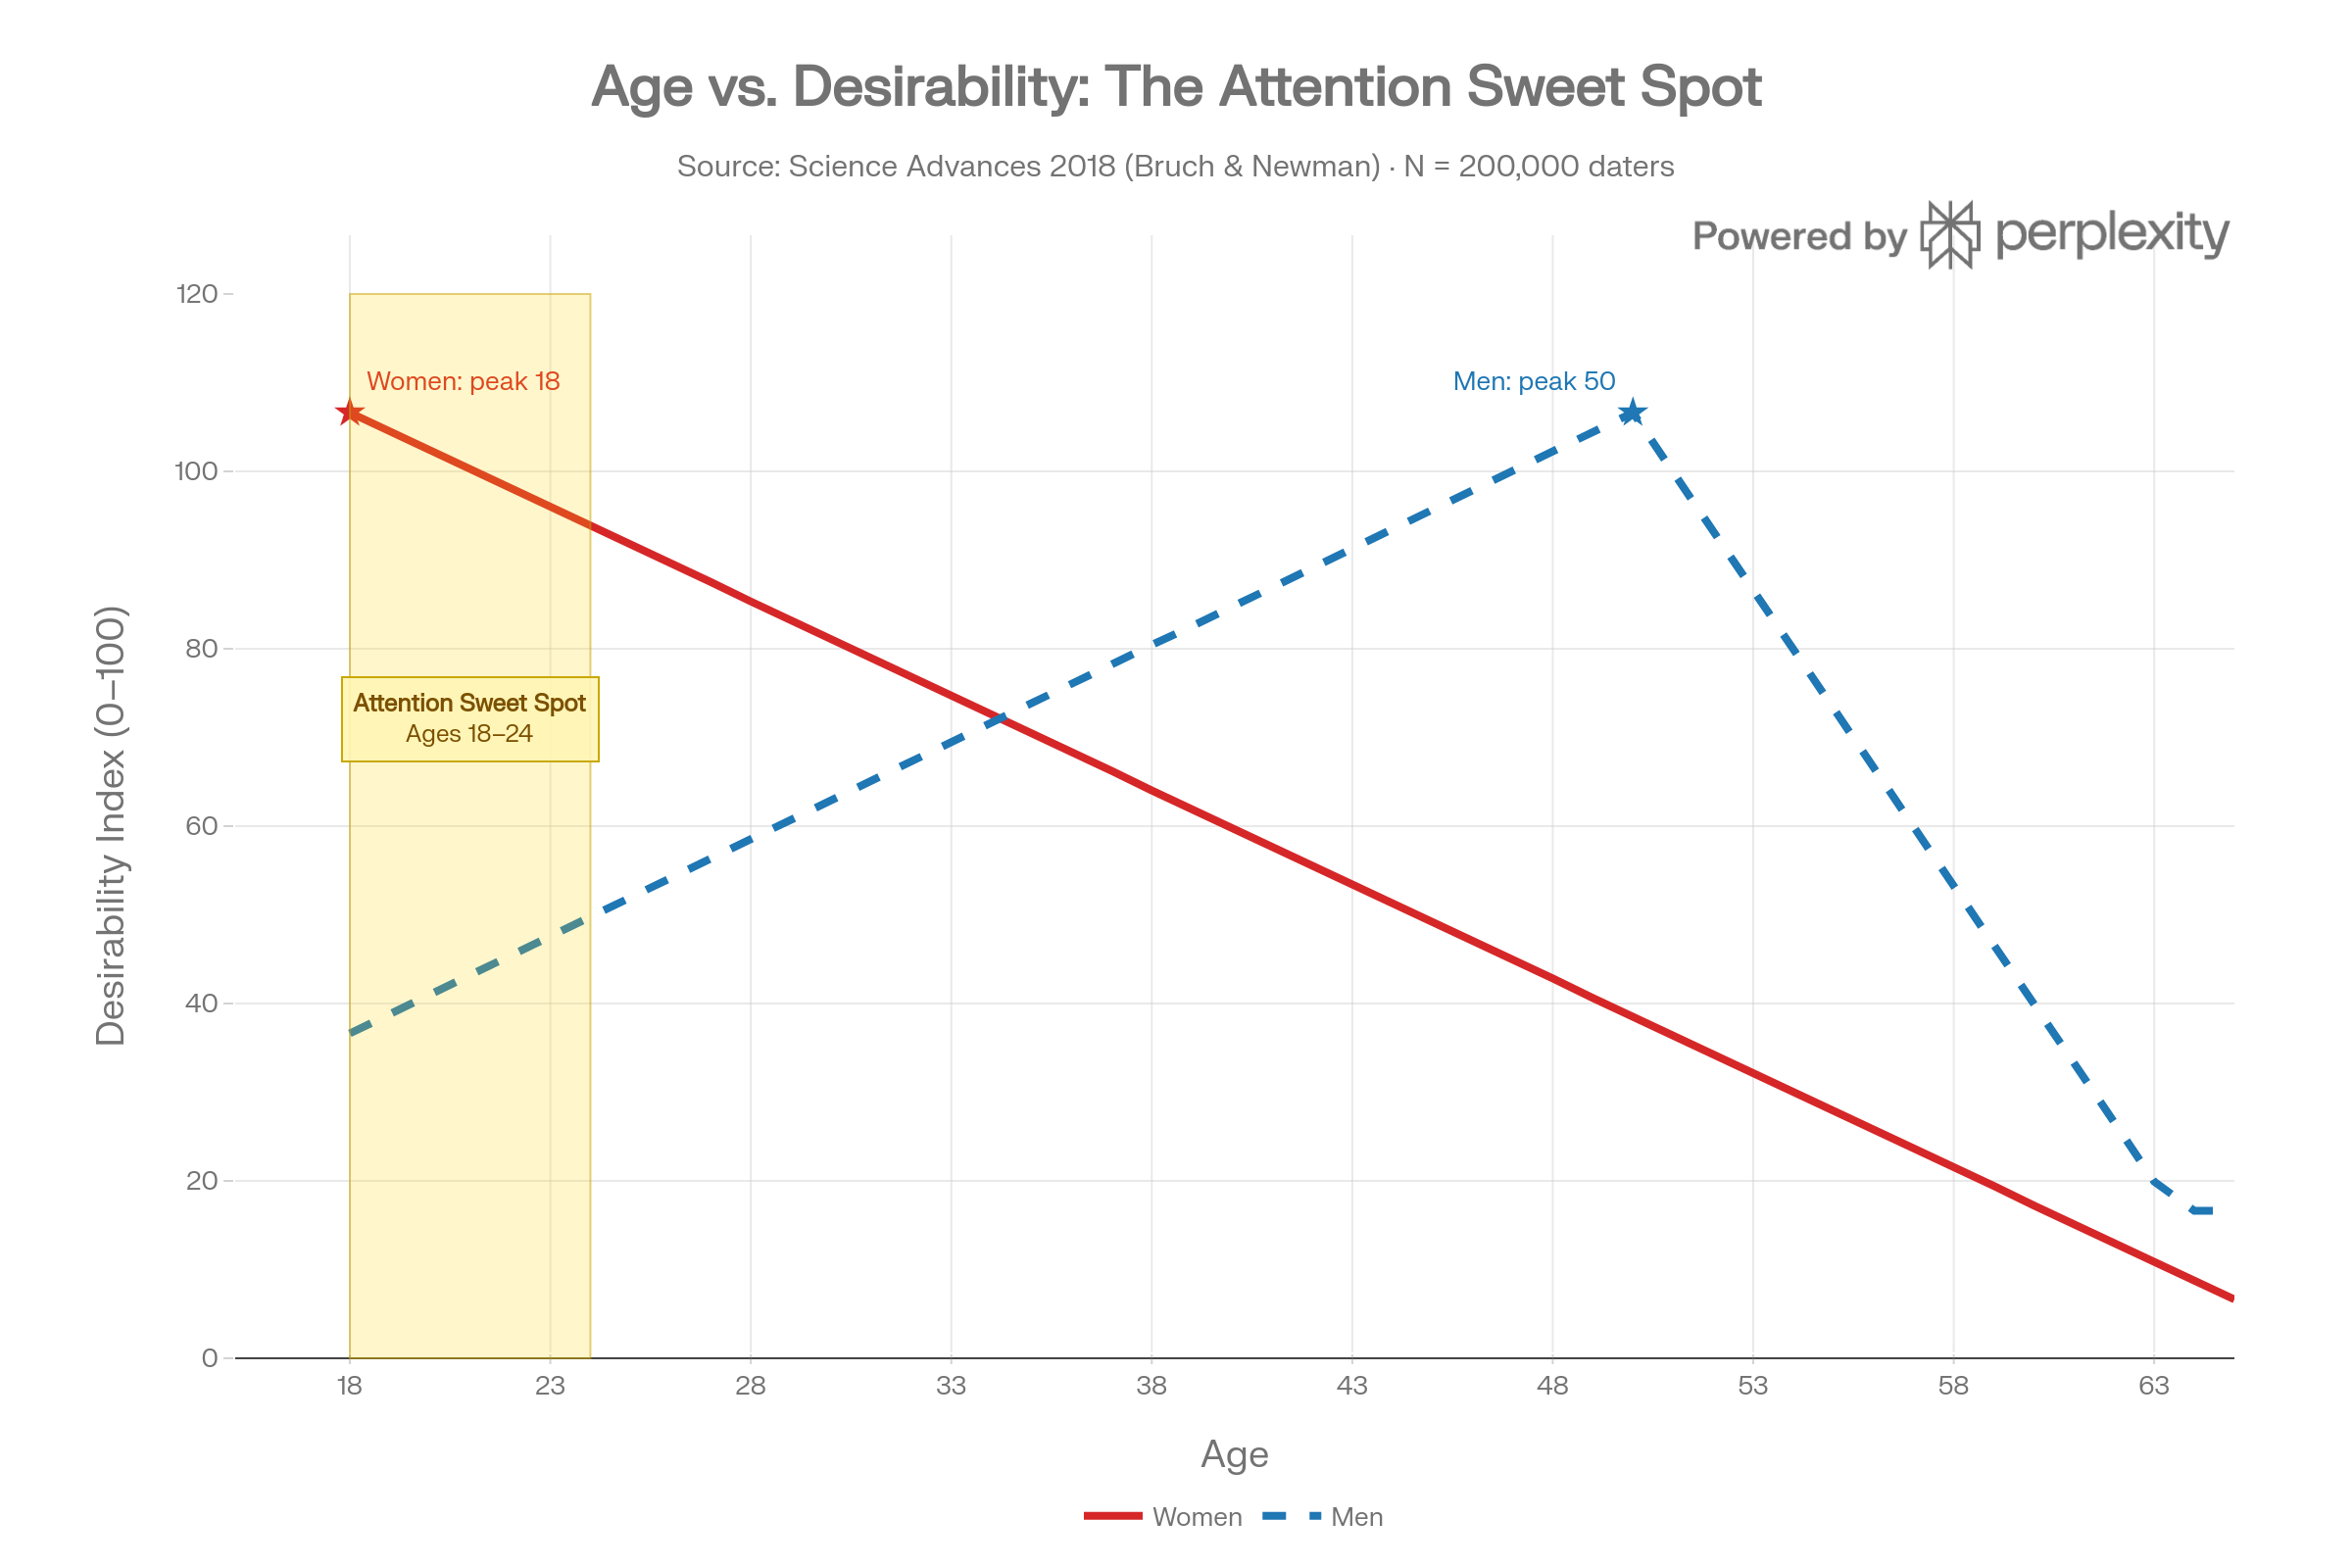
Chart 1 — The Attention Sweet Spot. Women’s desirability peaks at 18 and declines continuously; men’s desirability rises with status and accumulated resources. Source: Bruch & Newman, Science Advances (2018).
Stat
Value
Source
Study sample size
200,000 heterosexual online daters
Bruch & Newman, Science Advances, 2018
Women’s desirability trajectory
Peaks at 18, declines continuously to 60
Bruch & Newman
Men’s desirability trajectory
Rises steadily, peaks at age 50
Bruch & Newman
Men age 20–50 asked what age looks best
20 or 21 — in 26 of 31 male age groups
OkCupid Dataclysm (Rudder, 2014)
Median 30-year-old man
Spends as much time messaging teens as women his own age
OkCupid internal data
Tinder age concentration
38% of users 16–24 · 45% aged 25–34
BusinessOfApps 2026
Peak attention age bracket for women
18–24 — across every platform studied
Aggregate
Section 4
Attention Inequality (The Gini)
Dating-app like-distributions, measured against national income inequality.
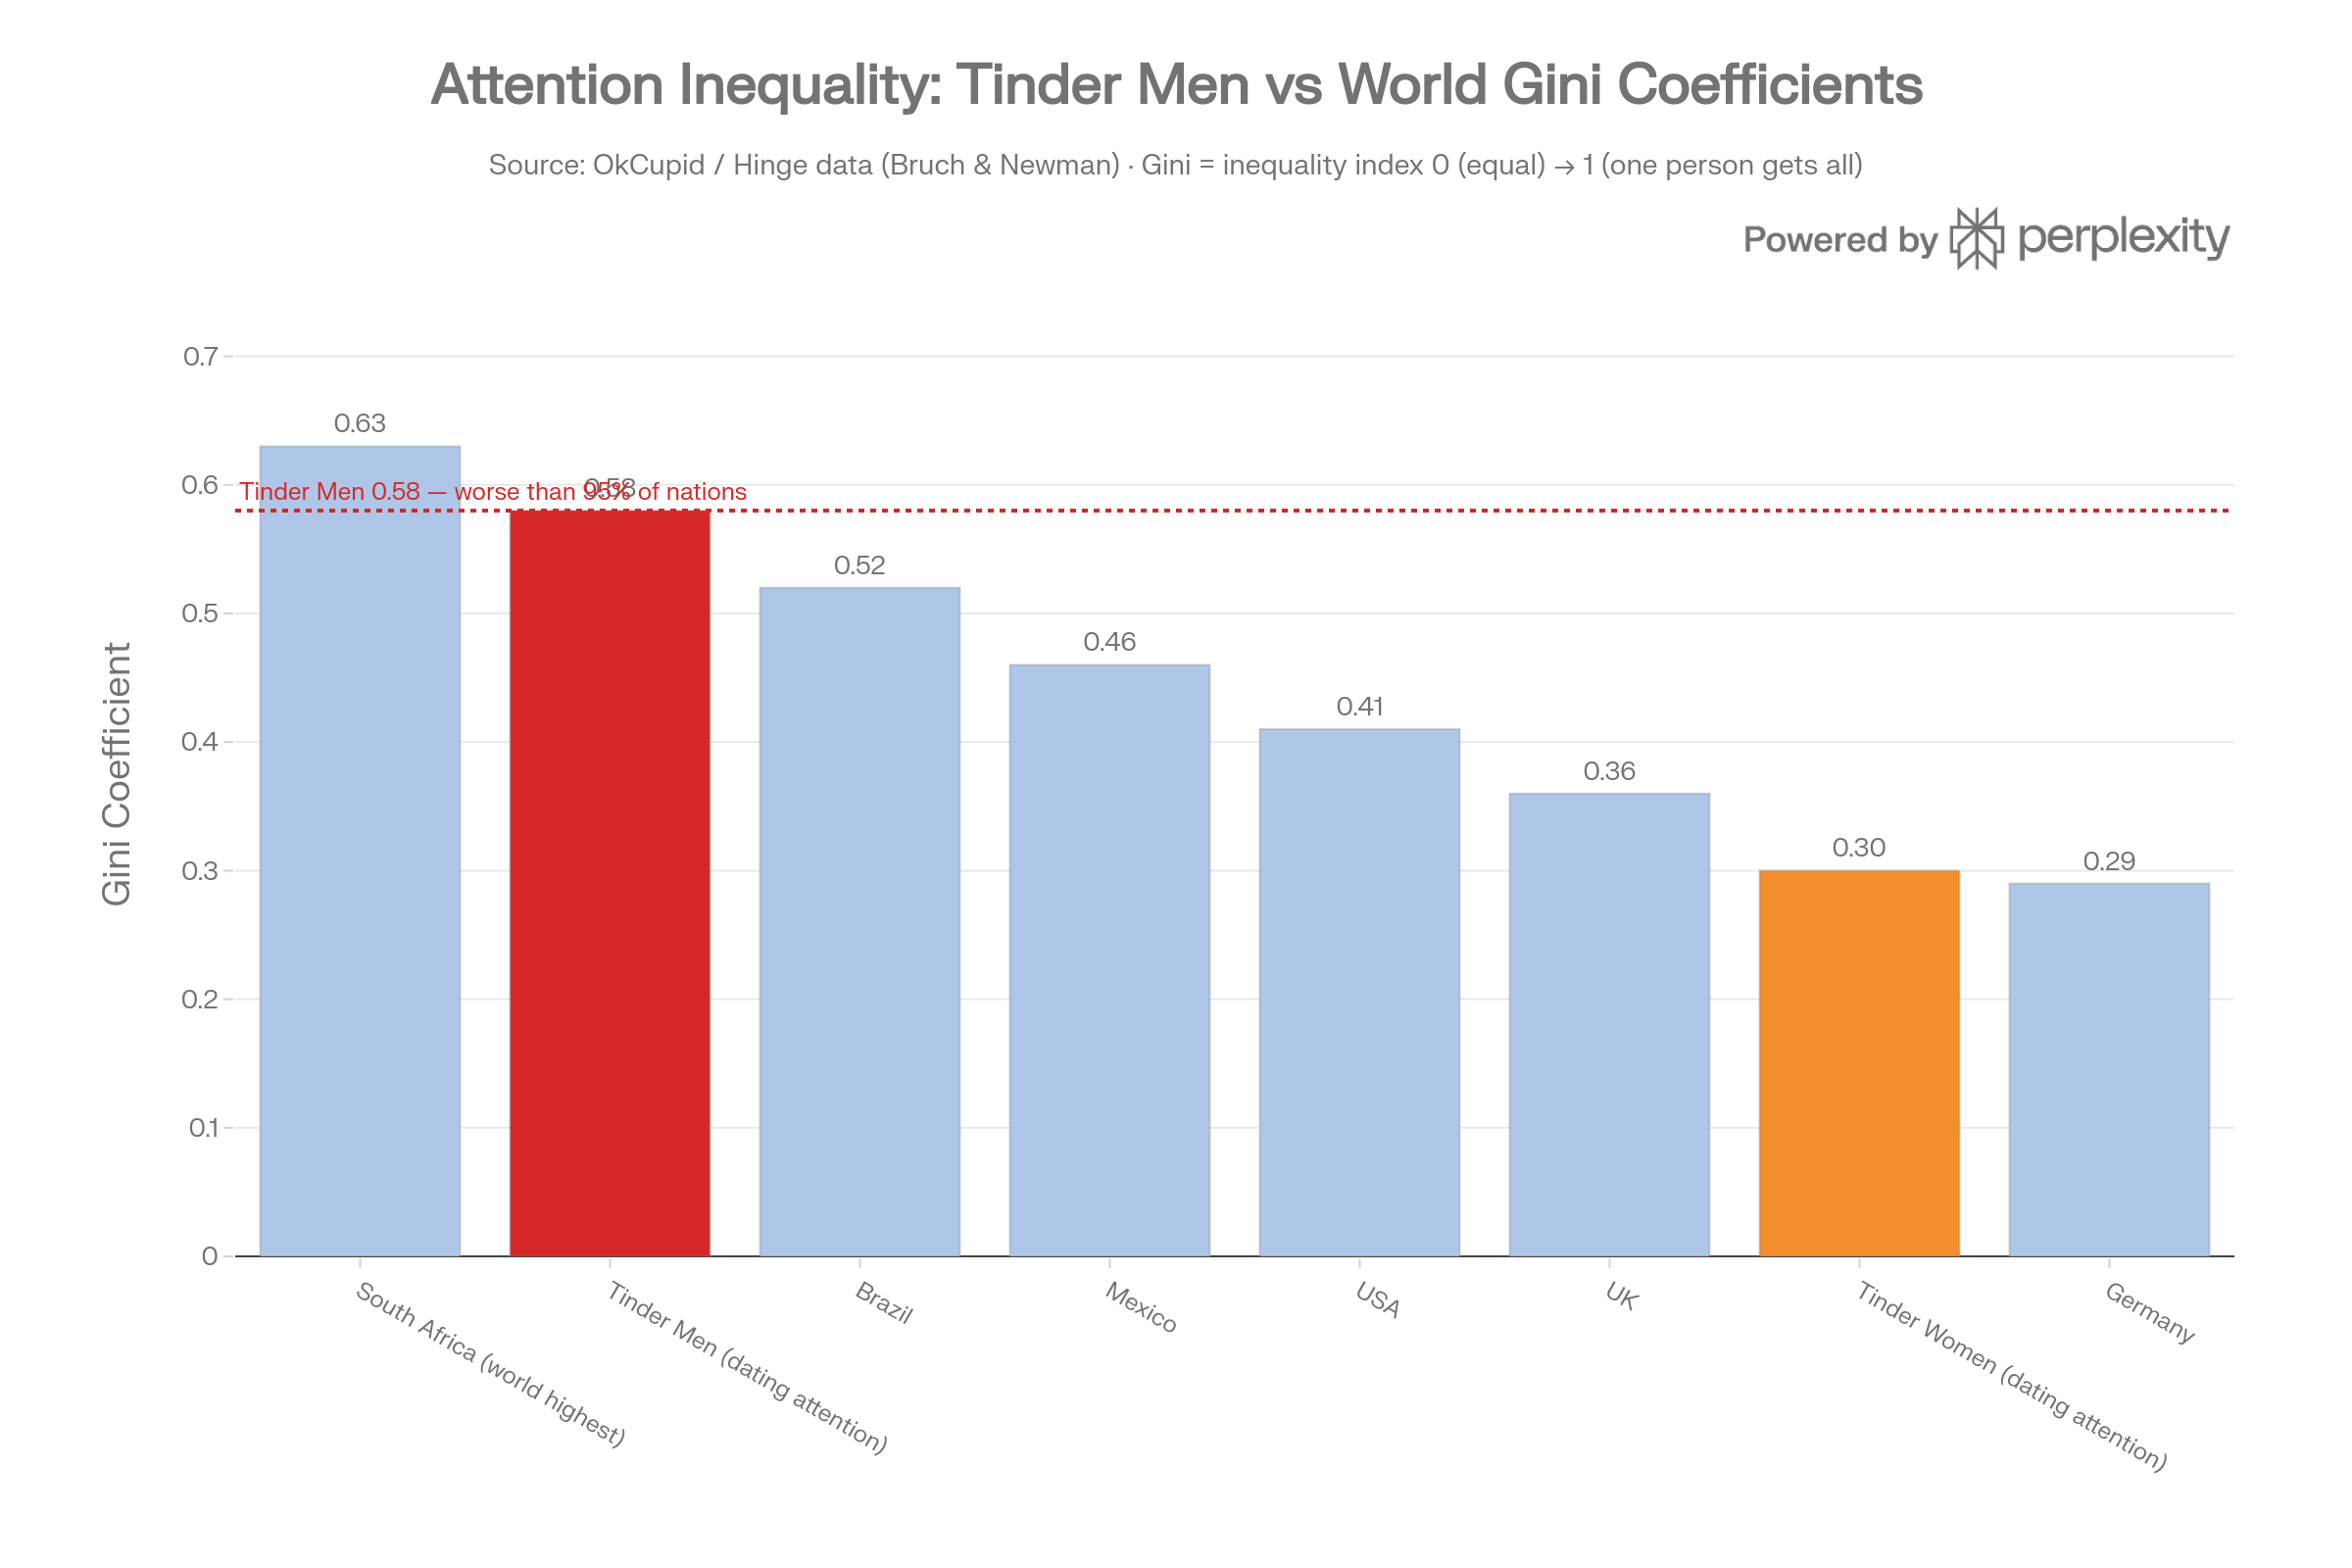
Chart 2 — Attention Gini. Tinder men sit at a Gini of 0.58 — worse than income inequality in roughly 95% of the world’s nations. Source: Hinge / OkCupid analyses; World Bank Gini comparison.
Stat
Value
Source
Men’s Gini coefficient (attention on dating apps)
0.58
Hinge / OkCupid data
Comparable national Gini (income)
South Africa = 0.63 · U.S. = 0.41
World Bank
Men’s dating Gini worse than
~95% of the world’s nations
Cross-referenced
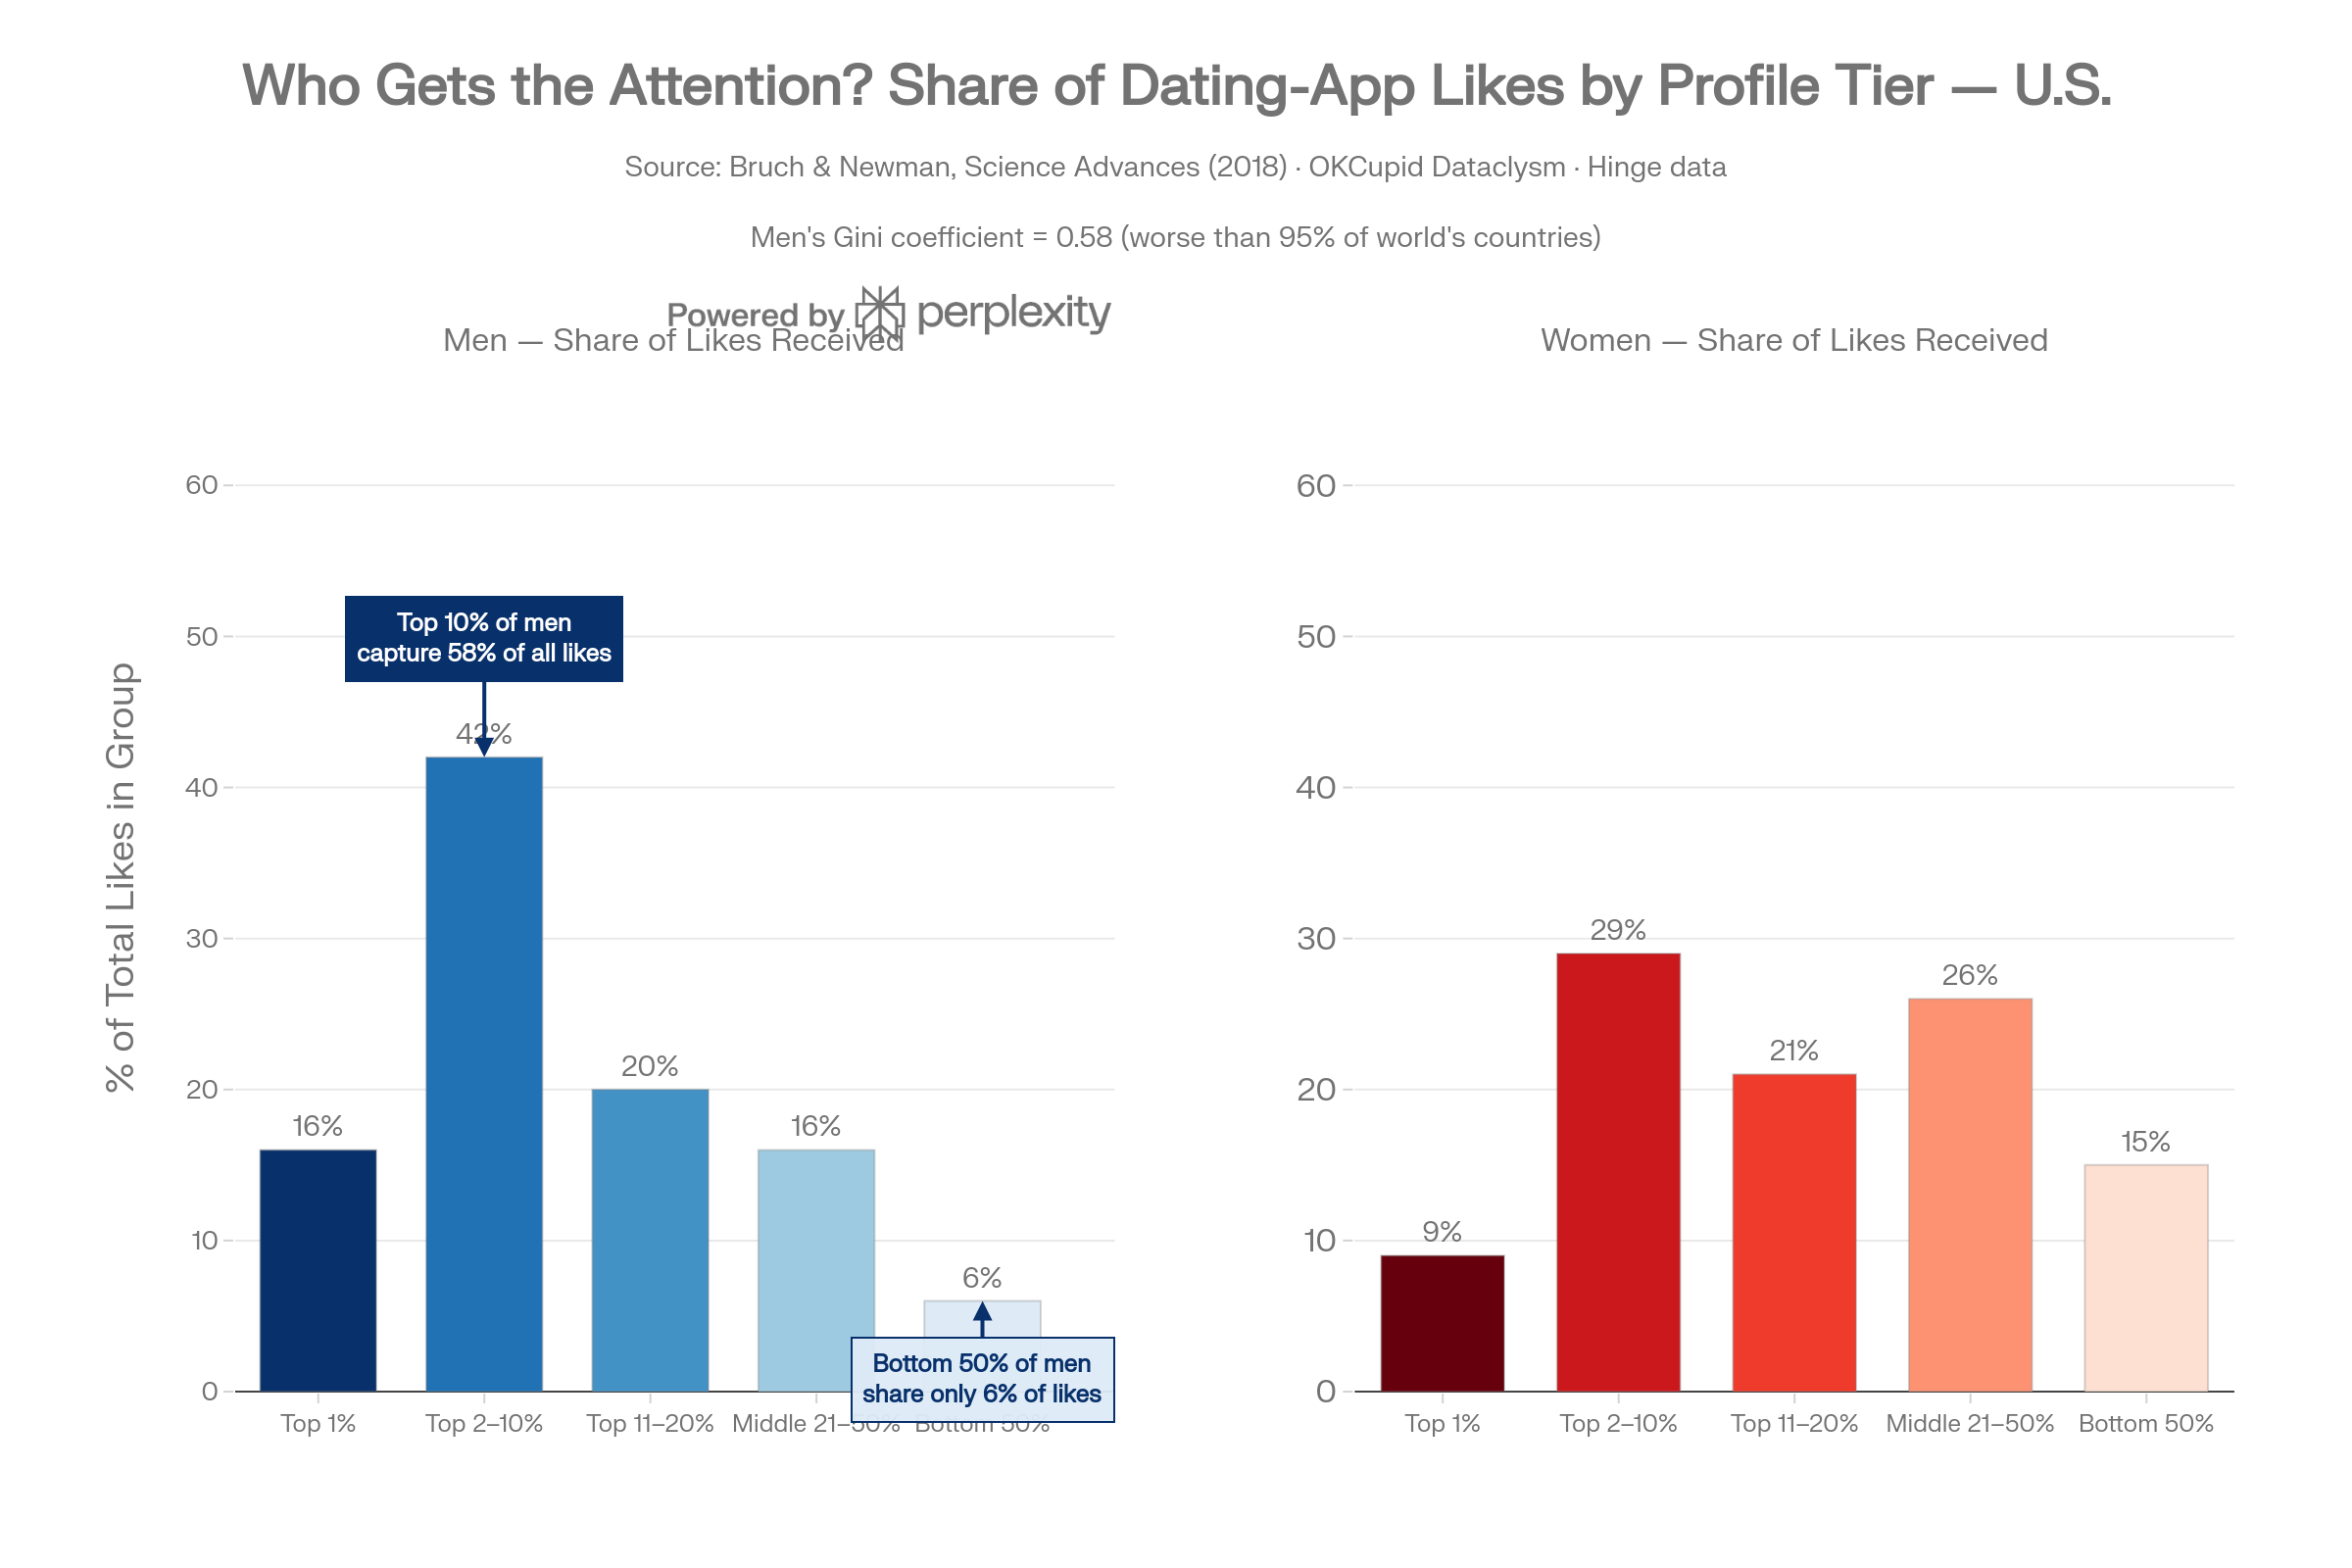
Top 10% of men receive
58% of all female likes
Hinge internal
Top 20% of men receive
~78% of all female likes
OkCupid / Hinge
Bottom 50% of men share
~6% of all female likes
Hinge data
Top 1% of men receive
~16% of all likes
Hinge internal
Average man’s match rate
0.6% — 1 match per 140 right-swipes
Tinder / Cross River Therapy
Women who rate 80% of men below average
Documented
Rudder, Dataclysm
Women swipe right on men
5–14% of male profiles
Multiple app sources
Men swipe right on women
61% of female profiles
Tinder internal data
Section 5
Prostitution
The base layer: time, body, proximity converted to transaction.
Stat
Value
Source
Global sex workers
~40–42 million
WHO estimates
U.S. active sex workers
~1 million
Urban Institute
Female share
~70% · ages 18–29 majority
Urban Institute
Primary buyer profile
~80% married men · ages 40–50
John research
U.S. men who have ever paid for sex
15–20%
Multiple surveys
Women who entered for survival/drugs (18–25)
73.2%
Farley et al.
Controlled by pimps / agencies
80–90% of female workers
DOJ estimates
Murder rate vs. general female population
60–100× higher
Potterat et al.
Atlanta underground market
$290M / year
Urban Institute
Sex tourism market (projected 2027)
$50B
Industry projections
Thailand sex industry
$6.4B–$27B / year · 3–14% of GDP
UNAIDS / Thai gov.
Colombia — % of women ever in sex work
~8%
Fundación Renacer
Colombia — % of workers who are minors
12%
Fundación Renacer
Section 6
Pornography
Where the body became copyable, searchable, and free.
Stat
Value
Source
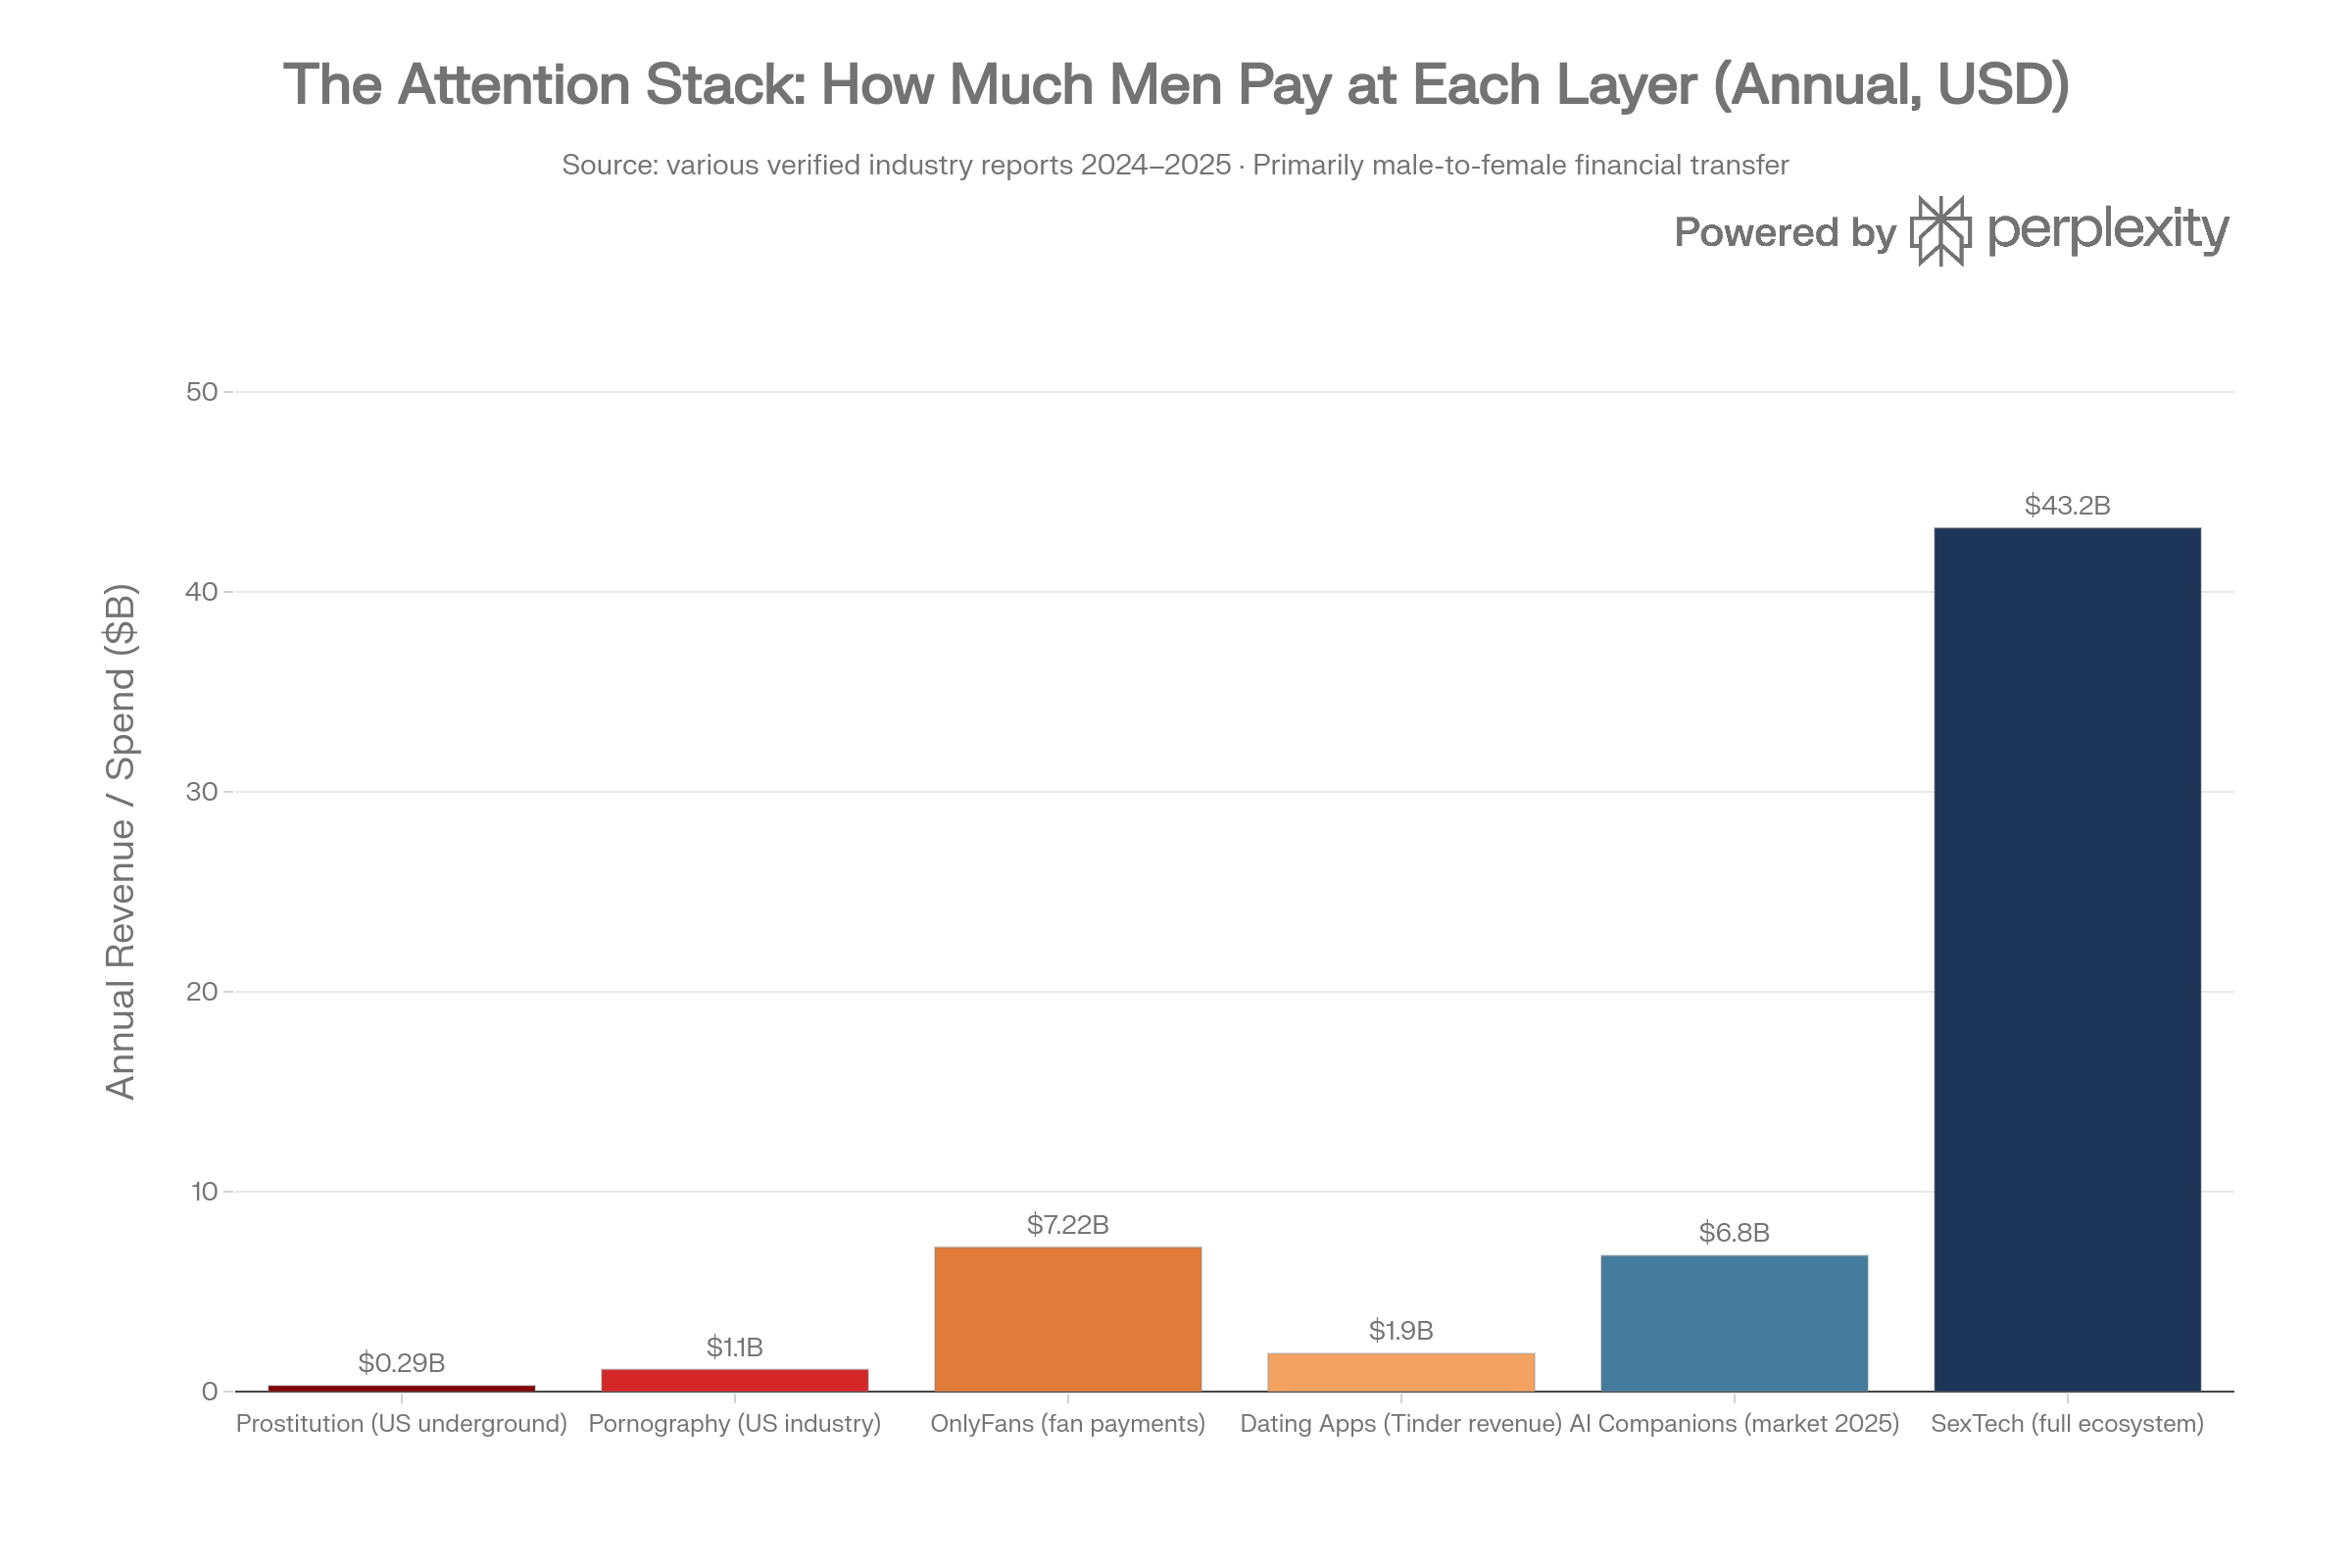
U.S. porn industry revenue (2023)
$1.1B+
CNBC / industry reports
Pornhub daily visitors — male share
64%
Pornhub Insights
Male teens who watch monthly
67%
Common Sense Media
Average age of first male exposure
Age 7–8
Multiple peer-reviewed
Full SexTech ecosystem (2025)
$43.2B → $250B by 2035
Grand View Research
Section 7
OnlyFans
Personalized intimacy at industrial scale.
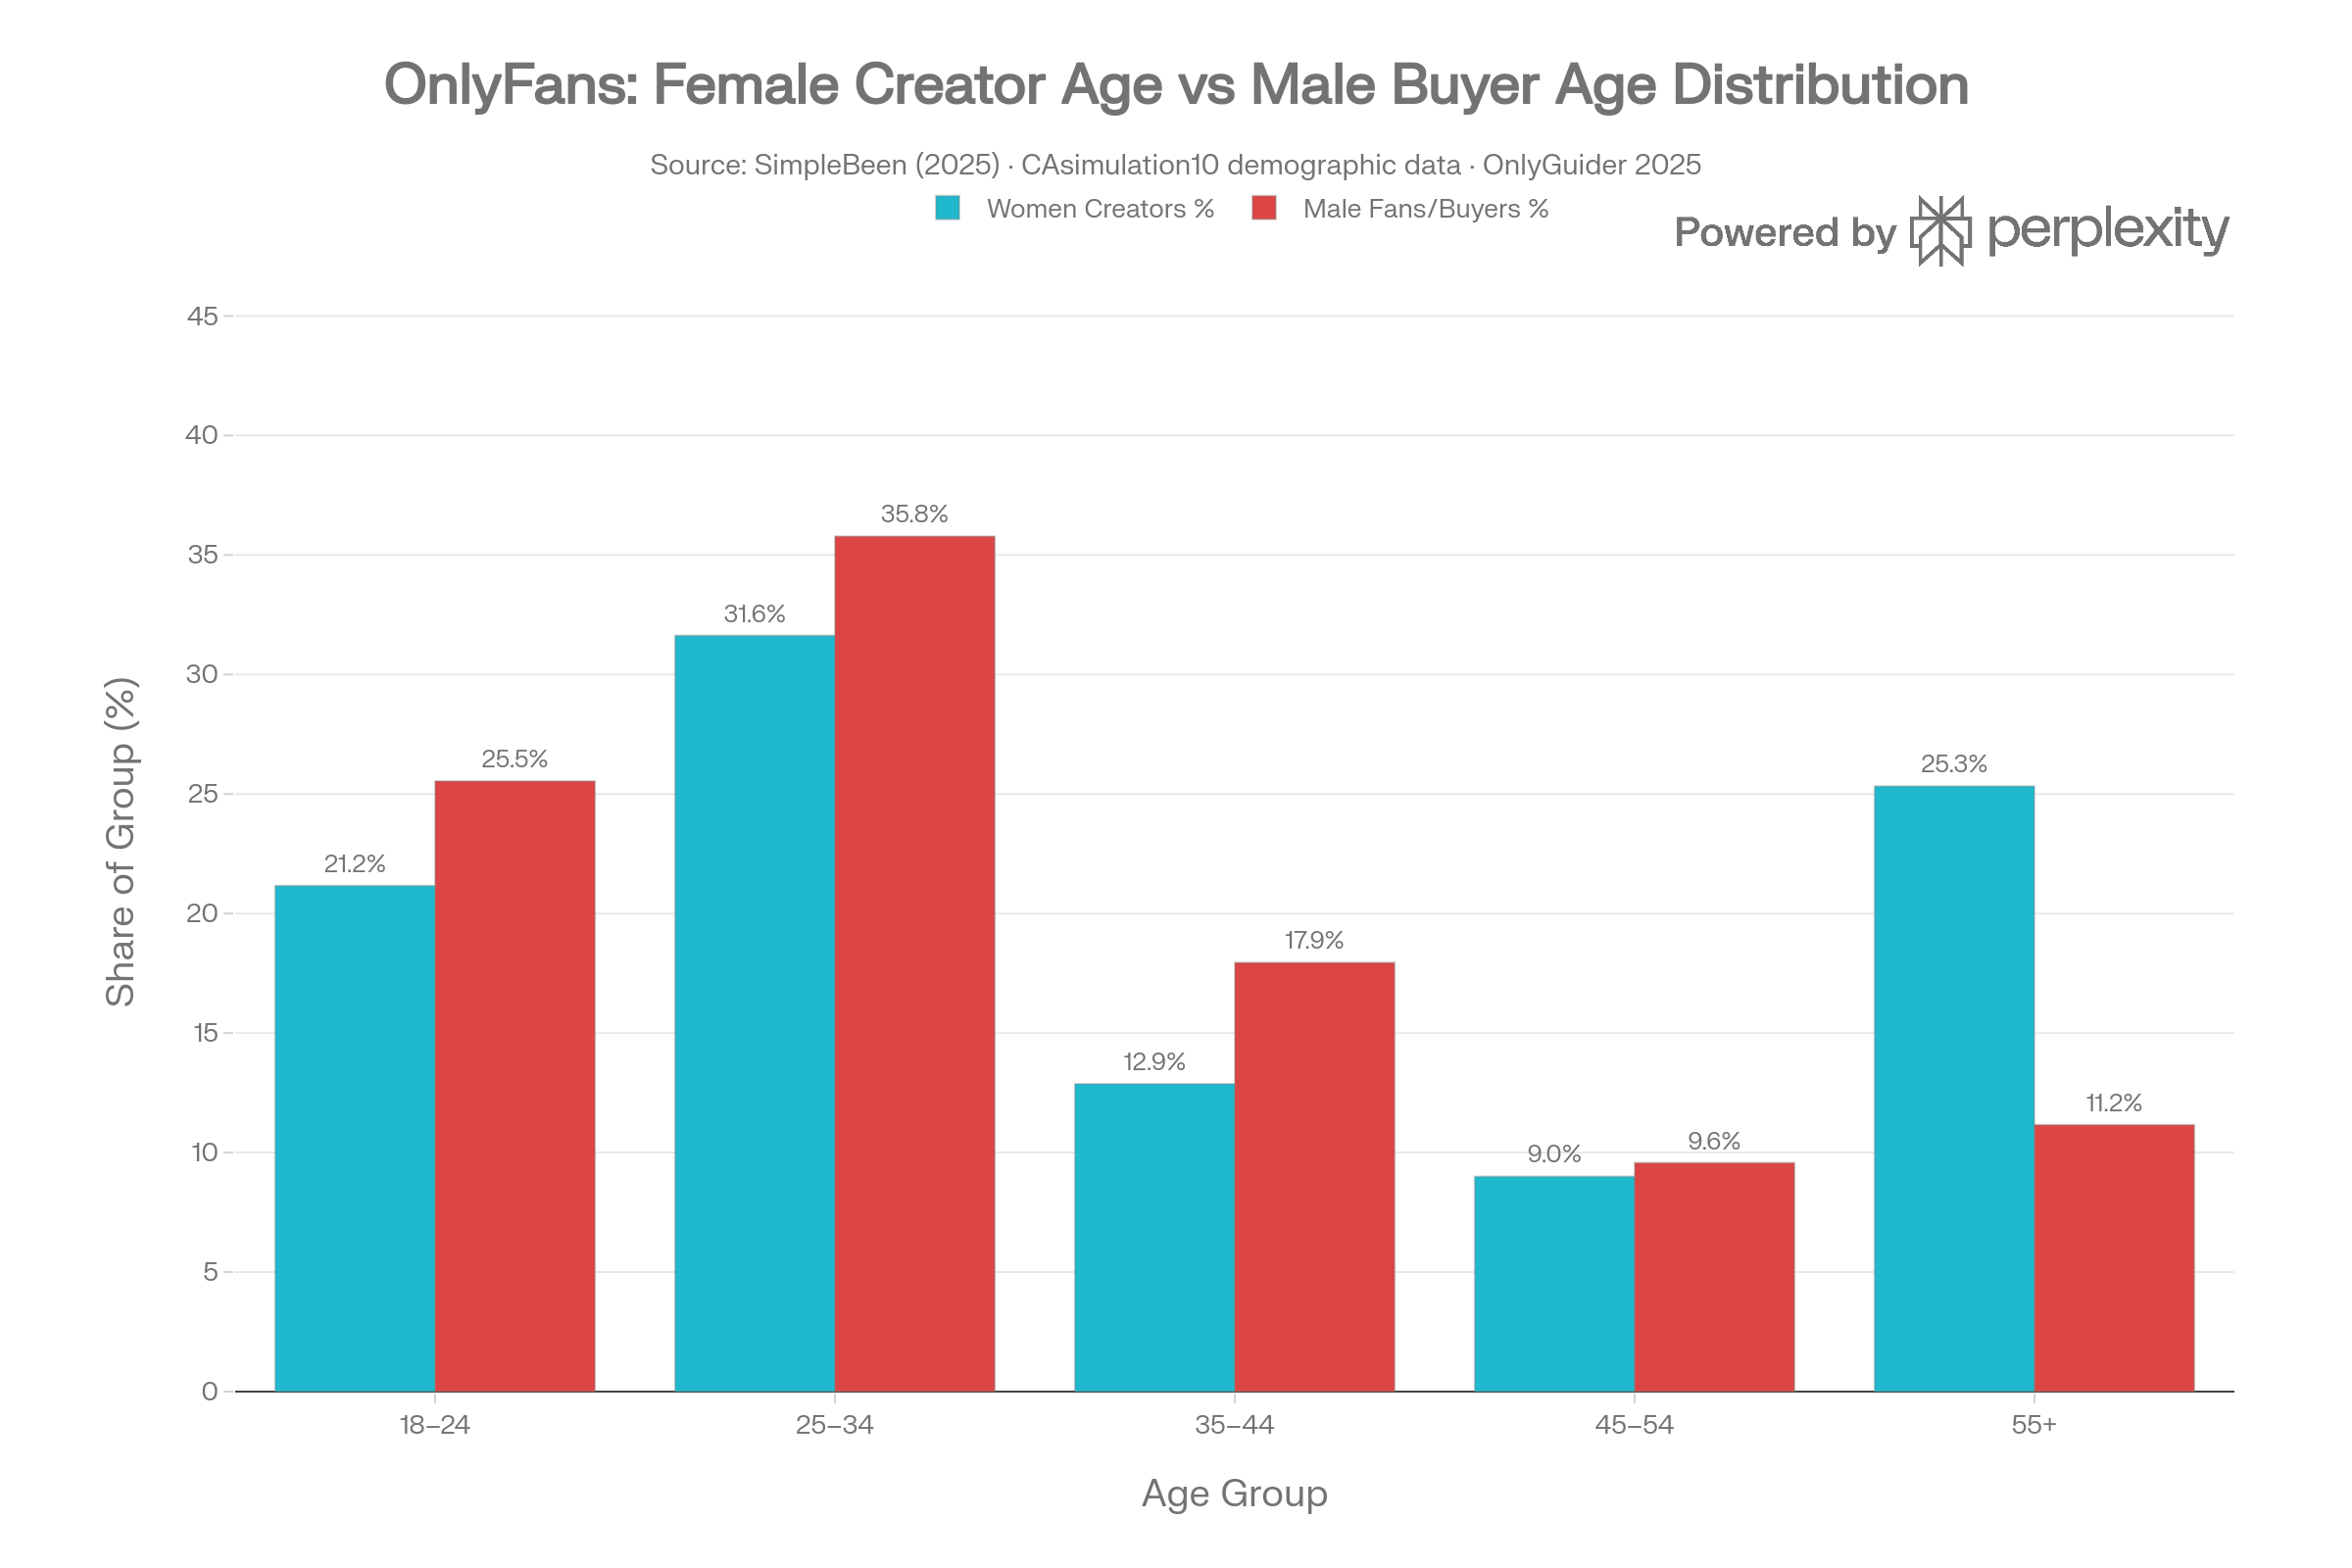
Chart 3 — OnlyFans age distribution. Both creators and buyers cluster heavily 18–34. 89.5% of paying subscribers are married men.
Platform scale
Metric
Value
Source
Total registered users
377.5 million
SimpleBeen 2025
Active creators
4.19–4.63 million
OFStats / SimpleBeen
Fan payments (2024)
$7.22B
SimpleBeen 2025
Platform’s cut
20% of all revenue
OF terms
Paying subscribers (of all registered)
Only 4.2% ever spend anything
SimpleBeen
The “1 in 7” fact-check
Verified replacement
The widely-cited claim that “1 in 7 (14%) U.S. women aged 18–24 are on OnlyFans” is a viral extrapolation — OnlyFans has never released age-disaggregated creator data.
The most defensible primary-sourced figure is roughly ~2% of U.S. women aged 18–45 as OF creators. The 8–14% range for 18–24 is a derived estimate — directionally plausible but not primary-sourced.
Creator demographics
Age
% of Female Creators
18–25
21.17%
26–35
31.63%
36–45
12.87%
46–55
9.0%
56+
25.33%
Buyer demographics
Age
% of OF Buyers
18–24
25.54%
25–34
35.78%
35–44
17.95%
45–54
9.57%
55–64
6.45%
65+
4.72%
Married subscribers
89.5%
The income reality
Metric
Value
Source
Average creator earnings
$131 / month post-fee
SimpleBeen
Most creators earn
Under $200 / month
OFStats
Top 1% earn
33% of all revenue
OFStats
Top 10% earn
90% of all revenue
OFStats
Section 8
Instagram & the Soft Attention Layer
The lobby of the paid-intimacy economy.
Stat
Value
Source
Average likes per post — women
578
Influencer Marketing Hub
Average likes per post — men
117
Influencer Marketing Hub
Women get how many more likes
5× more likes than men
Influencer Marketing Hub
Men engaging female content
10× more likely than engaging male content
Influencer Marketing Hub
Male likes going to other men
Only 13%
IMH data
U.S. users 18–24
26.5% of all U.S. Instagram users
Statista 2025
Creator economy brand spend (2025)
$37B — growing 4× faster than total media
Influencer Marketing Hub
Instagram as traffic source for OF creators
Primary funnel for top earners
Multiple creator reports
New followers women gain daily from listing IG on dating profiles
5–100 / day
Social media research
Section 9
Dating Apps
The distribution network.
Chart 4 — Dating apps: gender split. Across the U.S., men are roughly 71% of dating-app users. In Europe, closer to 85%.
Gender split by platform
Platform
Male Users
Female Users
Tinder
75.8%
24.2%
Bumble
68%
32%
OKCupid
74%
26%
Hinge
65%
35%
U.S. average
~71%
~29%
Europe average
~85%
~15%
Behavior & spending
Stat
Value
Source
Men who use apps for paid features
41% vs. 29% women
Pew 2023
Men spending $100+/month on dating
57% vs. 35% women
LendingTree
Men giving gifts monthly in relationship
35% vs. 21% women
LendingTree
Men spending more when in relationship
78% vs. 62% women
LendingTree
Tinder annual revenue
~$1.9B — majority male subscribers
BusinessOfApps
Married users on dating apps
30% of Tinder users
BusinessOfApps
Women using apps for validation
41% cite confidence boost
Attachment Project 2026
Validation as stated motivation for app use
#2 overall motivation across both genders
Academic research
Dating app satisfaction (2025)
22% — down from 44% in 2019
Pew Research
Men who have “given up” on dating
47%
Pew Research
Section 10
Influencer / Podcast Economy
Cooper vs. Tate — the two poles of the attention war.
Stat
Value
Source
Call Her Daddy — listeners in 2 months of launch
0 → 2 million
Industry reports
Spotify deal (2021)
$60M exclusive
Variety
SiriusXM deal (2024)
$100M
Bloomberg
Spotify followers
4.4M — #2 globally behind Joe Rogan
Chartable
UK teen boys (16–17) who consumed Andrew Tate content
80%
UK survey
Young men (16–25) with positive view of Tate
1 in 3 (31%)
UK survey
Incel community aged 18–30
82%
Research survey
Section 11
Marriage & Divorce
The last safe haven, under pressure from both sides.
Chart 5 — Marriage rate, U.S., 1970–2024. A drop from 10.6 to 6.0 per 1,000 — the lowest in recorded U.S. history.
Marriage collapse
Stat
Value
Source
U.S. marriage rate (2024)
6.0 per 1,000 — lowest in recorded U.S. history
CDC NCHS
Rate in 1970
10.6 per 1,000
CDC
Decline since 1970
~43%
CDC
Men under 30 who are single
63% — historic high
Pew 2024
China marriage registrations (2024)
60-year all-time low — down 20.5% in one year
Chinese Ministry of Civil Affairs
Projected never-married by 45 (2050)
1 in 3 young adults
Pew Research
Divorce
Stat
Value
Source
First marriages ending in divorce
~41%
CDC / NCHS
Overall divorce rate (2024)
2.3 per 1,000
CDC
Women initiate divorce — overall
69–70%
Rosenfeld, Stanford / ASA
Women initiate — college-educated couples
~90%
Rosenfeld, Stanford
Man’s probability she files on him (general)
50% × 70% ≈ 29%
Calculated
Man’s probability she files on him (college-educated wife)
50% × 90% ≈ 45%
Calculated
His agency over outcome (college wife)
50% × 10% ≈ 5%
Calculated
Divorce by education
Education Level
Divorce Rate
Source
Bachelor’s degree or higher
25.9%
BGSU / NCFMR
Associate’s degree
30.1%
BGSU
Some college
36.3%
BGSU
High school diploma
38.8%
BGSU
Less than high school
45.3%
BGSU
Alimony & custody
Stat
Value
Source
Alimony recipients who are women
97%
U.S. Census Bureau
Female alimony recipients
388,000 women
U.S. Census
Male alimony recipients
12,000 men
U.S. Census
Median alimony (20+ year marriage)
$5,000 / month
Legal surveys
Custodial parent is mother
5 of every 6 (83%)
Census Bureau
Men paying alimony (% of all divorce cases)
~72%
Legal research
Section 12
The Sexlessness Pyramid
Where the bottom of the pyramid becomes measurable.
Excess childless U.S. women vs. historical baseline
5.7 million more than expected
Brookings
Section 15
Transgender Demographic Shift
Handled with care — what the data shows, and what it does not.
Stat
Value
Source
U.S. adults who identify as transgender
2.1 million (0.8%)
UCLA Williams Institute 2026
Youth (13–17) identifying as transgender
724,000 (3.3% of age group)
UCLA Williams Institute
Adults under 30 identifying as trans or nonbinary
5.1%
Pew Research
Trans women (male → female) among trans adults
32.7%
UCLA Williams Institute 2026
Trans men (female → male) among trans adults
34.2%
UCLA Williams Institute 2026
Historical MTF-to-FTM ratio
~2.5–3:1 (MTF outnumbered FTM)
Amsterdam Gender Dysphoria Clinic
Current ratio (2026)
Trans men now slightly outnumber trans women
UCLA Williams Institute
When demographic flip occurred
2017–2022
Pew / UCLA data
Section 16
The Full Money Map
Annual men → women financial transfer, by channel.
Category
Annual Spend
Male Share
U.S. total annual dating spend
$117.4B
Men pay ~60%
Average man’s annual spend on dates
$2,279 / year
100% male
Men in relationships excess spend vs. women
$5,000–$15,000 / year more
100% male
OnlyFans fan payments
$7.22B / year
~90% male
Pornography (U.S.)
$1.1B+ / year
~64–80% male
Prostitution (U.S. underground)
~$1–2B / year
~99% male
AI companions
$6.8B / year
~75–85% male
Full SexTech
$43.2B / year
~85–90% male
Dating apps (paid subscriptions)
~$3B / year
Men are 41% of users but majority of payers
Alimony (annual U.S. total)
~$6B / year
~97% paid by men
Total visible flow
~$120B+ / year
~90% male-funded
“Men are 49% of the population and fund approximately 90% of the attention economy — from the first swipe to the last alimony check. The supply is female. The demand is male. The bill has always gone to one side of the table.”
Chart Index
Six Charts, Six Sections
A visual map of the appendix.
Chart
What It Shows
Key Stat
Chart 1 — Attention Sweet Spot
Women’s desirability peaks at 18; men’s at 50.
Golden zone = ages 18–24
Chart 2 — Attention Gini
Men’s dating inequality vs. world Gini scores.
Tinder men = 0.58 — worse than 95% of nations
Chart 3 — OnlyFans Age Distribution
Female creators vs. male buyers across age bands.
Both cluster 18–34 · 89.5% of buyers are married
Chart 4 — Dating Apps Gender Split
Male/female share by platform; U.S. and Europe averages.
U.S. average ~71% male · Europe ~85% male
Chart 5 — Marriage Rate Collapse
U.S. marriage rate, 1970 → 2024.
10.6 → 6.0 per 1,000 — lowest in U.S. history
Chart 6 — AI Companion Market
Virtual AI growth + SexTech ecosystem projection.
$6.8B → $42.5B (2034) · SexTech → $250B (2035)
Read the essay
Only Robots
The long-form essay that this appendix supports — six parts, the architecture of attention, and a reckoning with the machine being built to satisfy a 300,000-year-old desire.